Ingressi 2.0 is out

Self-hosted reverse proxy, built on Caddy

Route your domains to your apps with automatic HTTPS, load balancing and TCP and UDP proxying, configured from one dashboard. Turn on what each host needs: a web application firewall, sign-in in front of the app, geo blocking or rate limiting. Free, with no limits on hosts, nodes or users.

See it work

The dashboard

Screenshots of Ingressi with made-up traffic.

Publish an app

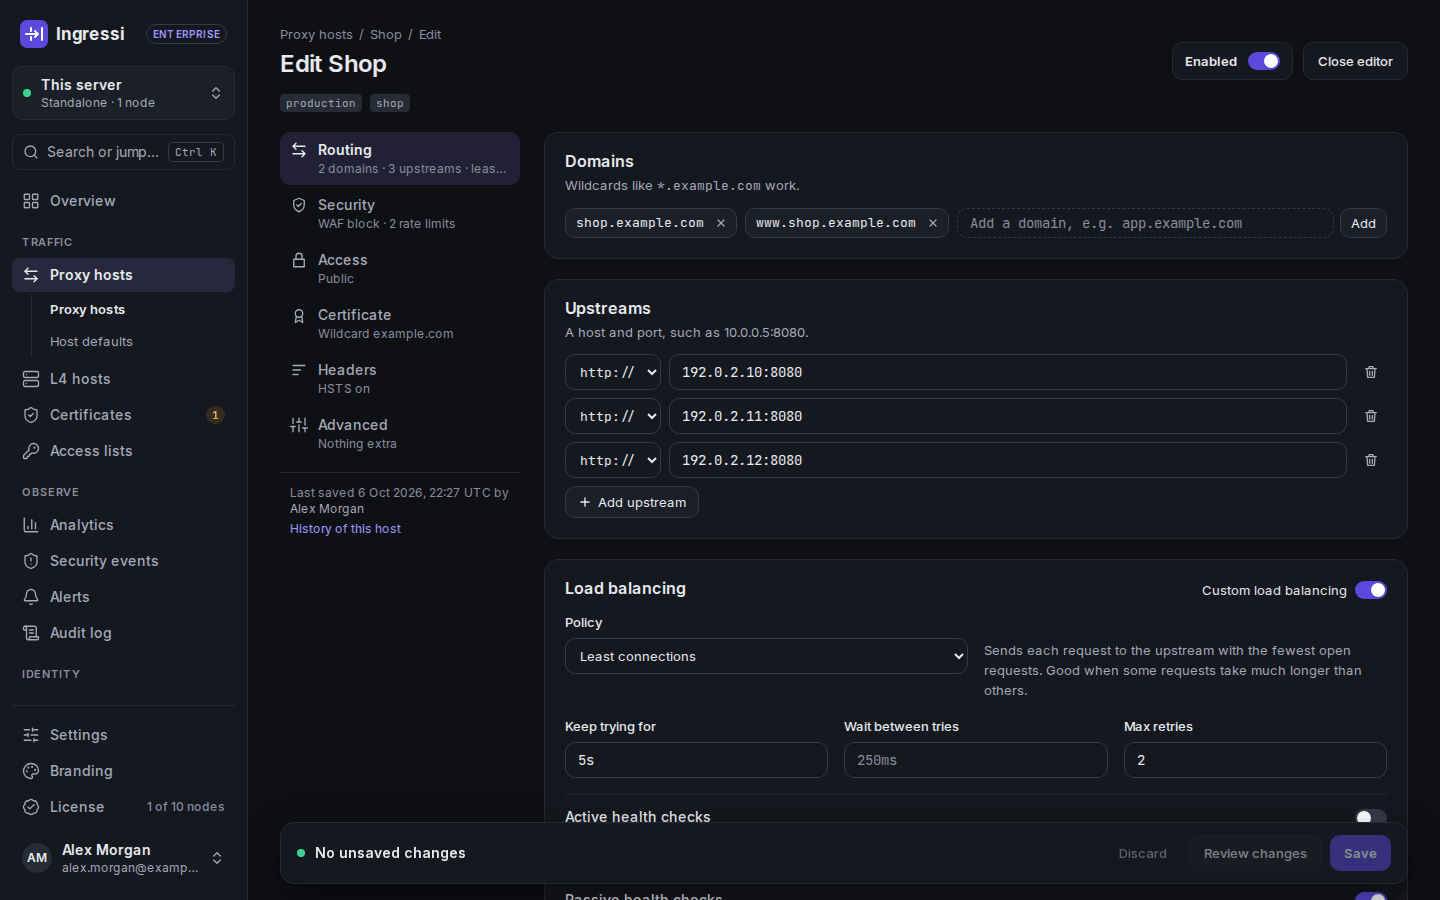
Domains, upstreams and load balancing for one host on one page, with its security, access and certificate a click away.

  1. Add the domains: Caddy gets their certificates.
  2. Several upstreams, with eight load-balancing policies.
  3. Security, access and certificate are sections of the same editor.
  4. Every change is reviewed before it is saved.
The proxy host editor for the host Shop: its domains, three upstreams and the load-balancing policy, the editor's sections on the left and the bar to review and save changes.

See what was stopped

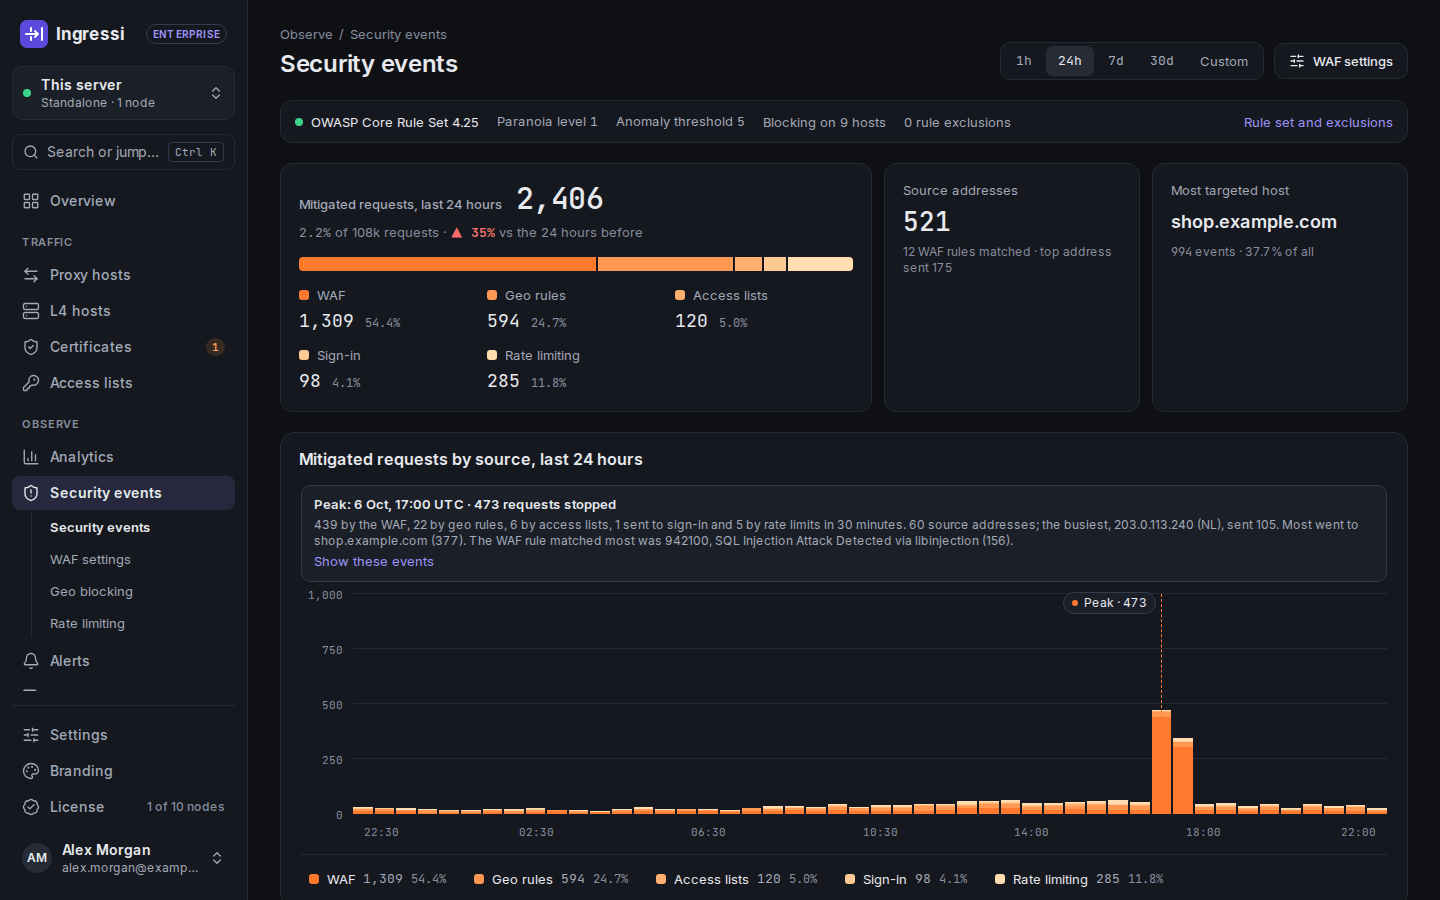
Security events counts every request Ingressi stopped, by what stopped it, and explains the busiest moment.

  1. Stopped requests by source: WAF, geo rules, access lists, sign-in and rate limits.
  2. The busiest half hour, explained in plain words.
  3. Bursts stand out against the usual traffic.
Security events for the last 24 hours: 2,406 mitigated requests split by WAF, geo rules, access lists, sign-in and rate limiting, an explanation of the peak at 17:00, and the stopped requests over time.

Know why each request was stopped

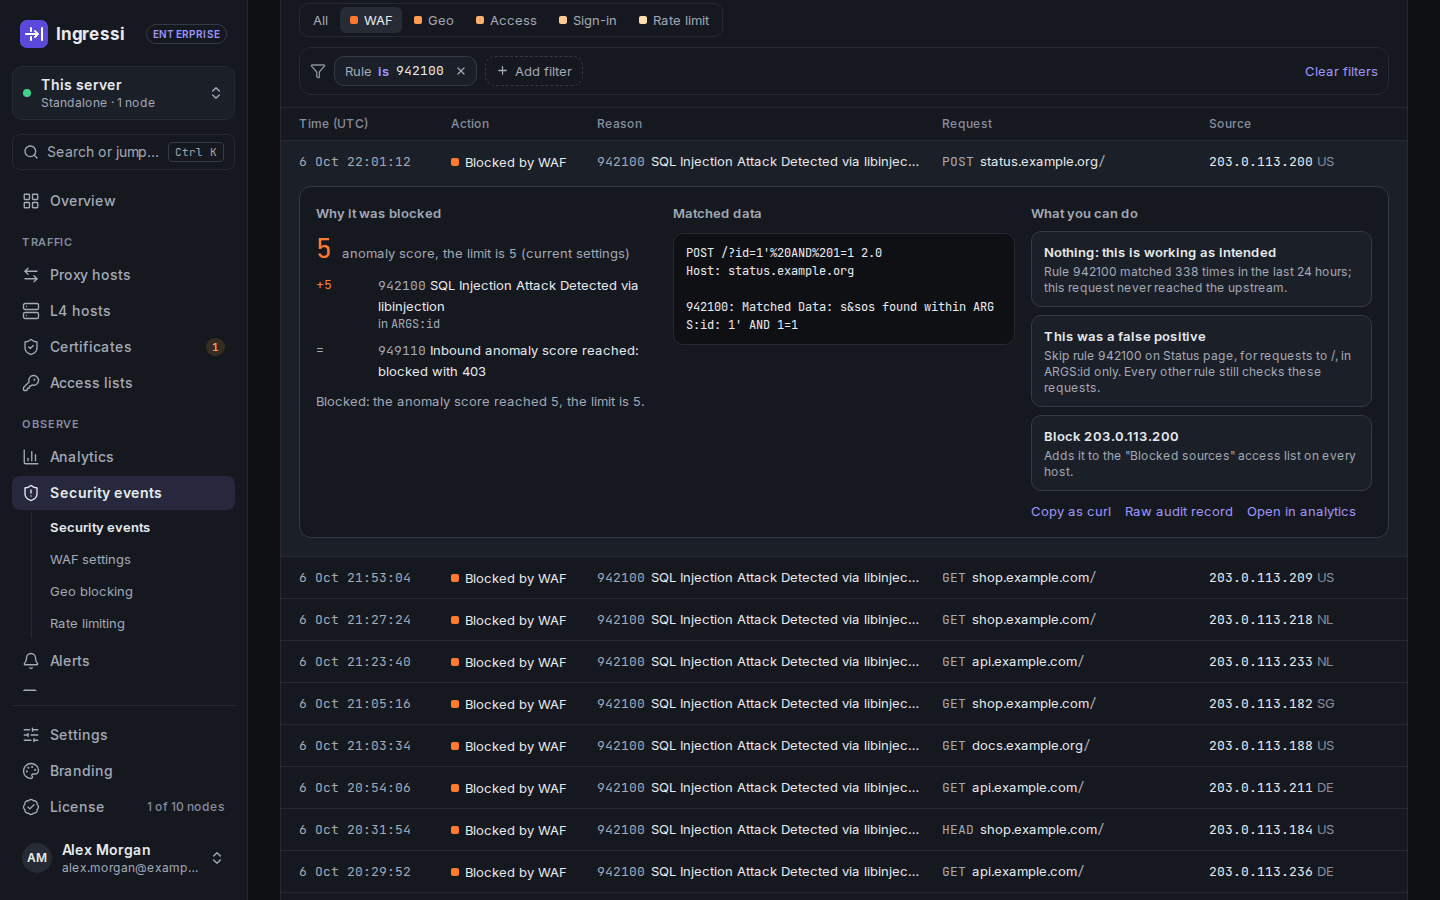
Open any event to see the rules that matched, the data they matched, and what you can do about it.

  1. Each rule that matched, and the anomaly score they add up to.
  2. The part of the request that matched.
  3. Next steps: an exclusion for this one rule if it was a false positive, or a block for the source on every host.
A WAF event opened in the list: rule 942100, SQL injection, raised the anomaly score to the limit of 5 and the request was blocked; the data it matched; and the next steps: nothing, an exclusion for this rule if it was a false positive, or blocking the source address.

Ask about your traffic

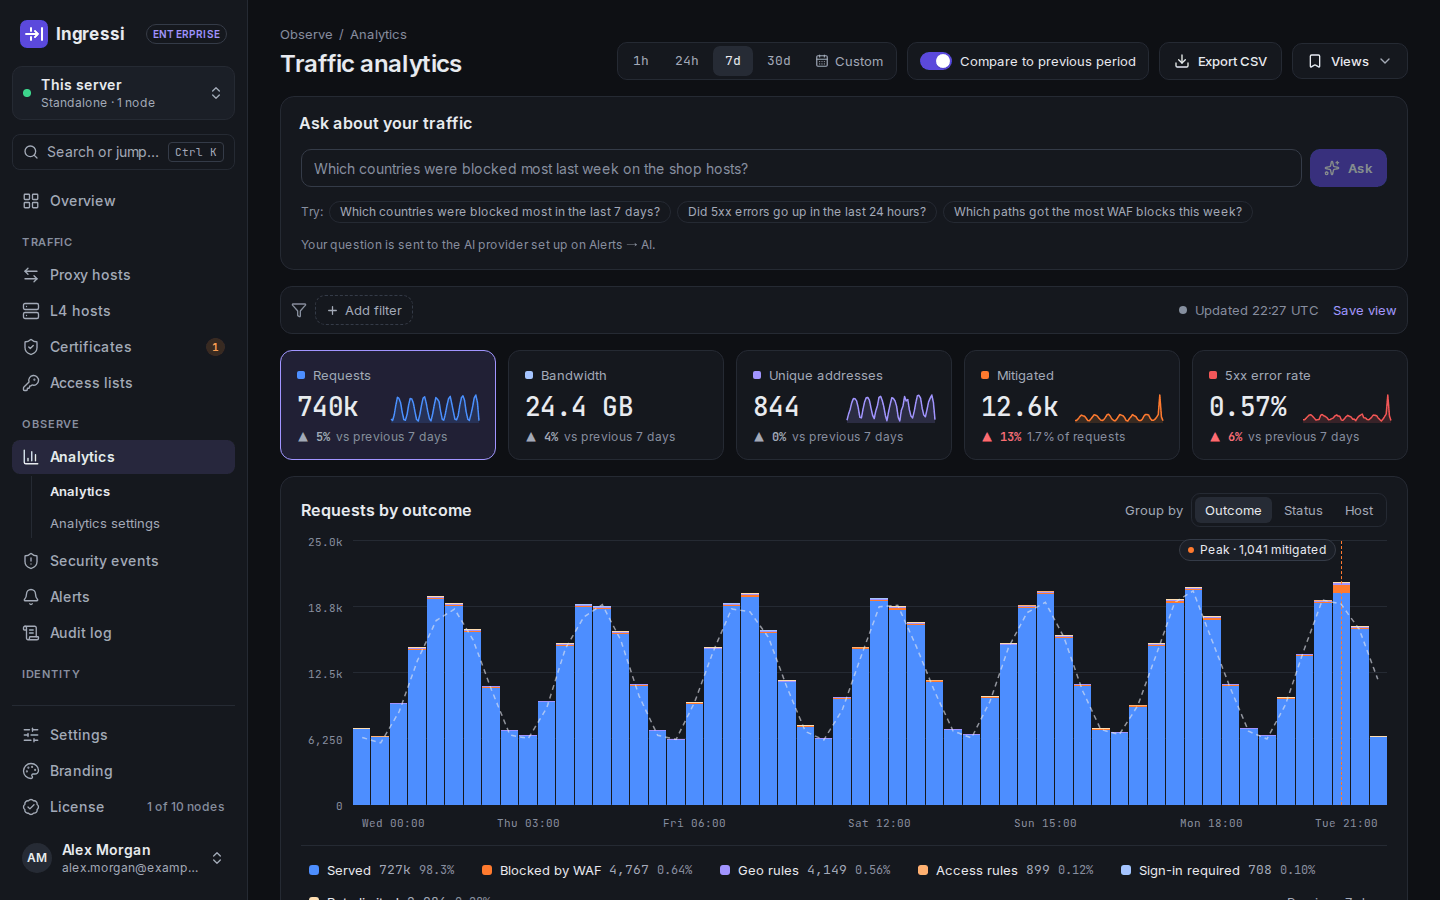
Every request is stored, nothing sampled. Filter by any field, or ask in plain words with the AI analyst.

  1. Questions in plain language, with the model you choose.
  2. Totals compared with the period before.
  3. Every request by outcome: served, blocked by the WAF, geo or access rules, sign-in, rate limits.
Traffic analytics for the last 7 days: the box to ask about your traffic, totals compared with the week before, and requests over time by outcome.

Watch each host

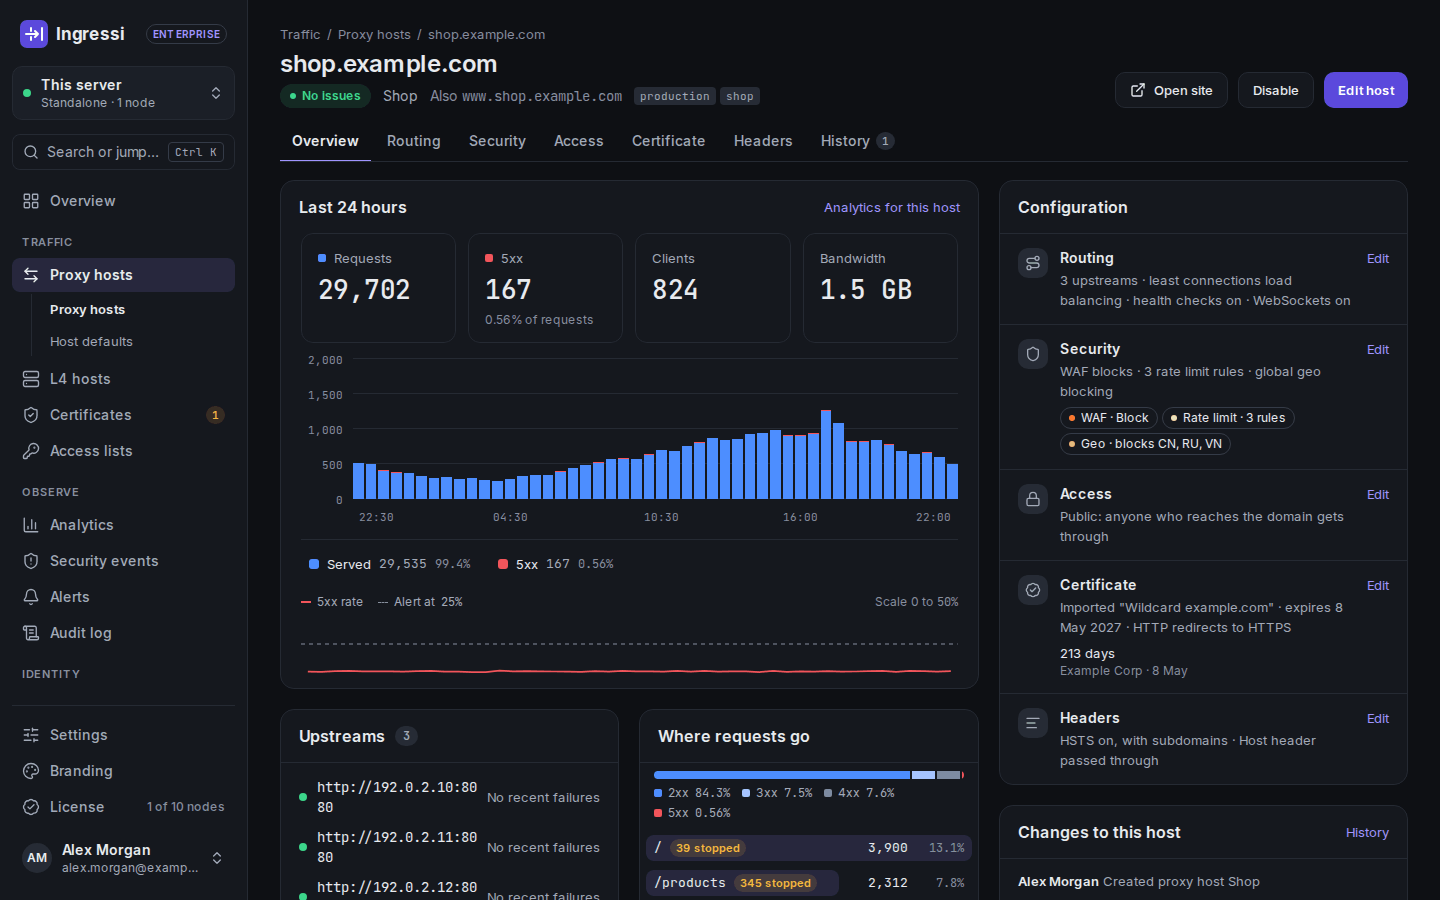
Each host has its own page with its problems, traffic, errors and a summary of its configuration.

  1. Problems first, if there are any.
  2. Requests, 5xx errors and bandwidth for this host.
  3. Its configuration, one line per section of the editor.
The page of the host shop.example.com: no issues, its requests and 5xx errors over the last 24 hours, and its routing, security, access, certificate and headers.

Prove what changed

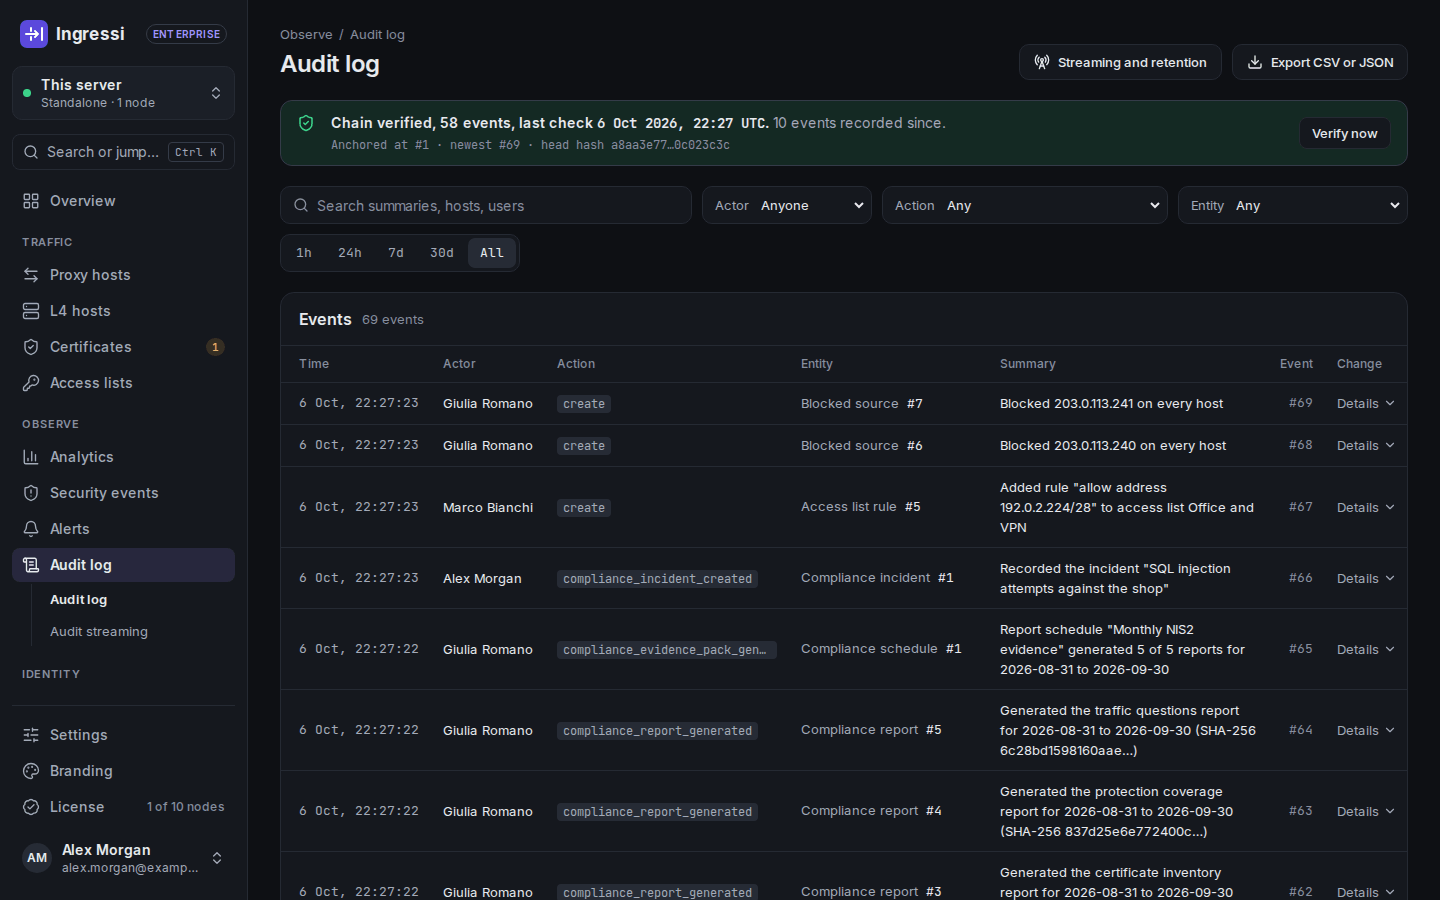
Every change and sign-in goes into an audit log linked into a hash chain, so a removed or edited event shows.

  1. The chain, verified on demand.
  2. Who changed what, with the before and after.
  3. Export it, or stream it to your SIEM.
The audit log: the hash chain verified, filters by actor, action and entity, and the latest events with who made each change.

On the way in

How a request reaches your app

Caddy terminates HTTPS and forwards the request to a healthy upstream. The checks in between are optional and off until you turn them on for a host; each can stop a request, and Security events says which one did.

  1. Client

    A browser, an app or a bot.

  2. HTTPS

    Caddy, with a certificate it renews itself.

  3. WAF

    Optional. The OWASP Core Rule Set.

    403
  4. Access rules

    Optional. Addresses, networks, countries.

    403
  5. Sign-in

    Optional. The built-in portal, or your own.

    302
  6. Rate limit

    Optional. Per address, header or user.

    429
  7. Your app

    Load balanced across healthy upstreams.

    200

What it does

Between the Internet and your apps

Every feature, by area.

Proxy hosts and automatic HTTPS

Several upstreams per host, eight load-balancing policies, health checks, redirects and rewrites, and layer 4 TCP and UDP proxying. Certificates from Let's Encrypt or your own ACME CA, DNS-01 through 22 DNS providers, and an optional built-in CA for client certificates (mTLS).

Optional WAF and security events

Off until you turn it on, for one host or for all hosts. Coraza with the OWASP Core Rule Set 4.25: paranoia levels 1 to 4, detection only or blocking per host, and exclusions scoped to a host, path or variable. Security events shows what was stopped and why, and blocks a source address from the same page.

Access rules, sign-in and rate limits per host

Each is off until you turn it on for a host. Ordered allow and deny rules by address, network, country, continent or AS number, HTTP basic auth, and one list of blocked sources for every host. A sign-in portal in front of any app, or Authentik and Authelia, and rate limits that answer 429.

Dashboard sign-in and directories

Dashboard sign-in through any OpenID Connect provider, with an authenticator app or a passkey as the second factor. SAML 2.0 and enforced SSO, LDAP or Active Directory, and SCIM from Microsoft Entra ID or Okta.

Traffic analytics

Every request in ClickHouse, 30 days by default, nothing sampled: outcomes, countries, networks, top lists, a request log and CSV export.

Roles and audit

Viewer, user and admin, and an audit log of every change in a tamper-evident hash chain. Custom roles scoped to tagged hosts, and streaming to syslog, a webhook or Splunk.

Compliance

Reports mapped to NIS2 and ISO/IEC 27001, periodic access reviews, four-eyes approval for protected hosts, and NIS2 incident drafts.

Fleet, PostgreSQL and high availability

Instance sync to replicas, and SQLite or PostgreSQL for the dashboard. Environments, canary rollouts and drift detection; shared certificates, dashboard replicas and automatic failover.

Alerts, history and backups

Alerts to e-mail, Slack, Teams, PagerDuty, ntfy or a webhook. A snapshot of every change with one-click rollback, and encrypted backups to your own S3.

AI analyst

Alert explanations, a daily security digest, WAF tuning suggestions and questions about your traffic. It uses the model you choose: Anthropic, or any OpenAI-compatible server, such as Ollama on your own network.

White-label

Your product name, logos, favicon and colours on the dashboard and every sign-in page.

Command palette

Ctrl+K searches hosts, certificates, users, pages, settings and documentation, and runs common actions.

REST API

Every resource under /api/v1, with tokens limited to chosen permissions, and OpenAPI 3.1 docs on your install.

Who it is for

Homelabs, teams and regulated companies

Ingressi is Italian for “entrances”.

Homelabs and self-hosters

Add a host, pick an upstream, and Caddy fetches the certificate.

Teams and agencies

Dashboard single sign-on, roles scoped to the hosts each team owns, an audit log of every change, and alerts.

Regulated companies

Evidence for NIS2 and ISO/IEC 27001, access reviews, four-eyes approval and installs without Internet access.

Caddy Proxy Manager is now Ingressi; existing installs keep working. Upgrade notes

Get started

You need a Linux server with Docker and Docker Compose.